Glossary of terms

G
  • Graph

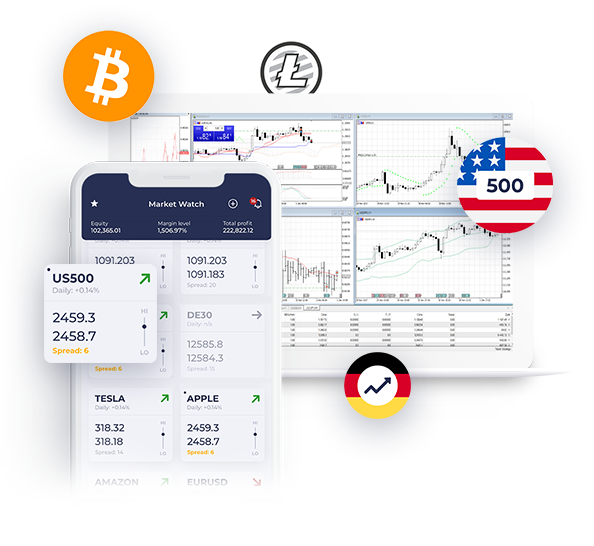
    The graphical presentation of price movements in a particular market in a particular price range. One of the most common type charts is the candlestick chart in which every candle shows an opening, closing price and the minimum and maximum fluctuations at the time.

CFDs are complex instruments and come with a high risk of losing money rapidly due to leverage.
71% of retail investor accounts lose money when trading CFDs with this provider.
You should consider whether you understand how CFDs work and whether you can afford to take the risk of losing your money.