Investīciju vārdnīca

G
  • Graph

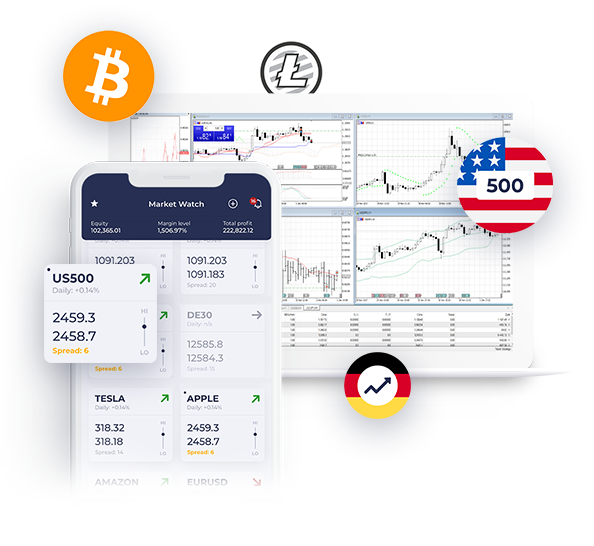
    The graphical presentation of price movements in a particular market in a particular price range. One of the most common type charts is the candlestick chart in which every candle shows an opening, closing price and the minimum and maximum fluctuations at the time.

CFD ir sarežģīti instrumenti, un tiem ir augsts risks attiecībā uz strauju naudas zaudēšanu sviras finansējuma dēļ.
72% no šā produktu sniedzēja privāto ieguldītāju kontiem zaudē naudu, veicot CFD tirdzniecību.
Jums būtu jāapsver tas, vai izprotat, kā CFD darbojas, un vai Jūs varat atļauties uzņemties augsto naudas zaudēšanas risku.